Regression analysis is a statistical method used to understand the relationship between a dependent variable and one or more independent variables. It’s a cornerstone in data science, providing the tools to predict outcomes, identify trends, and make informed, data-driven decisions. By quantifying the strength and nature of relationships between variables, regression analysis helps us comprehend how changes in independent variables influence the dependent variable.
Types of Regression

Linear Regression
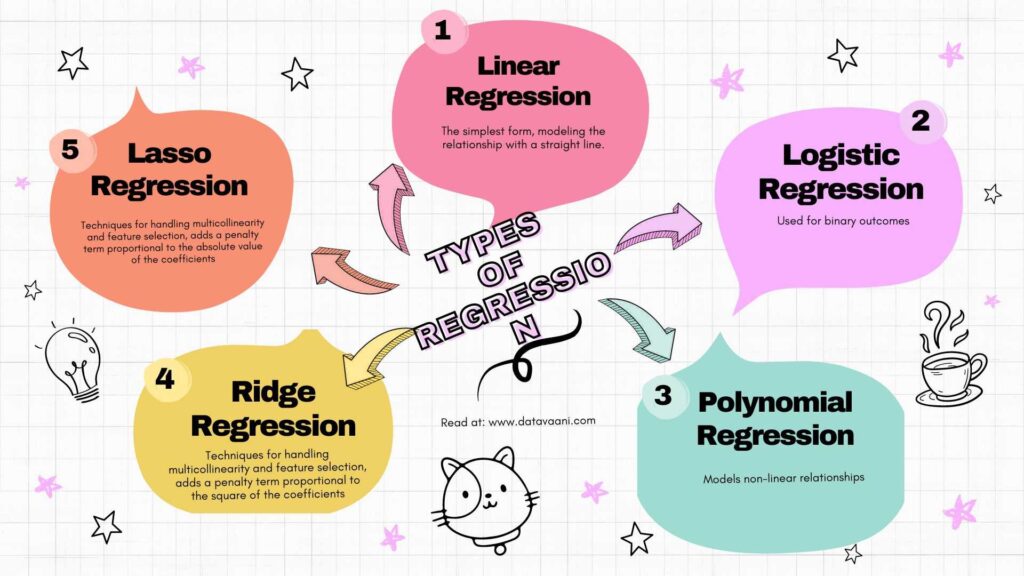
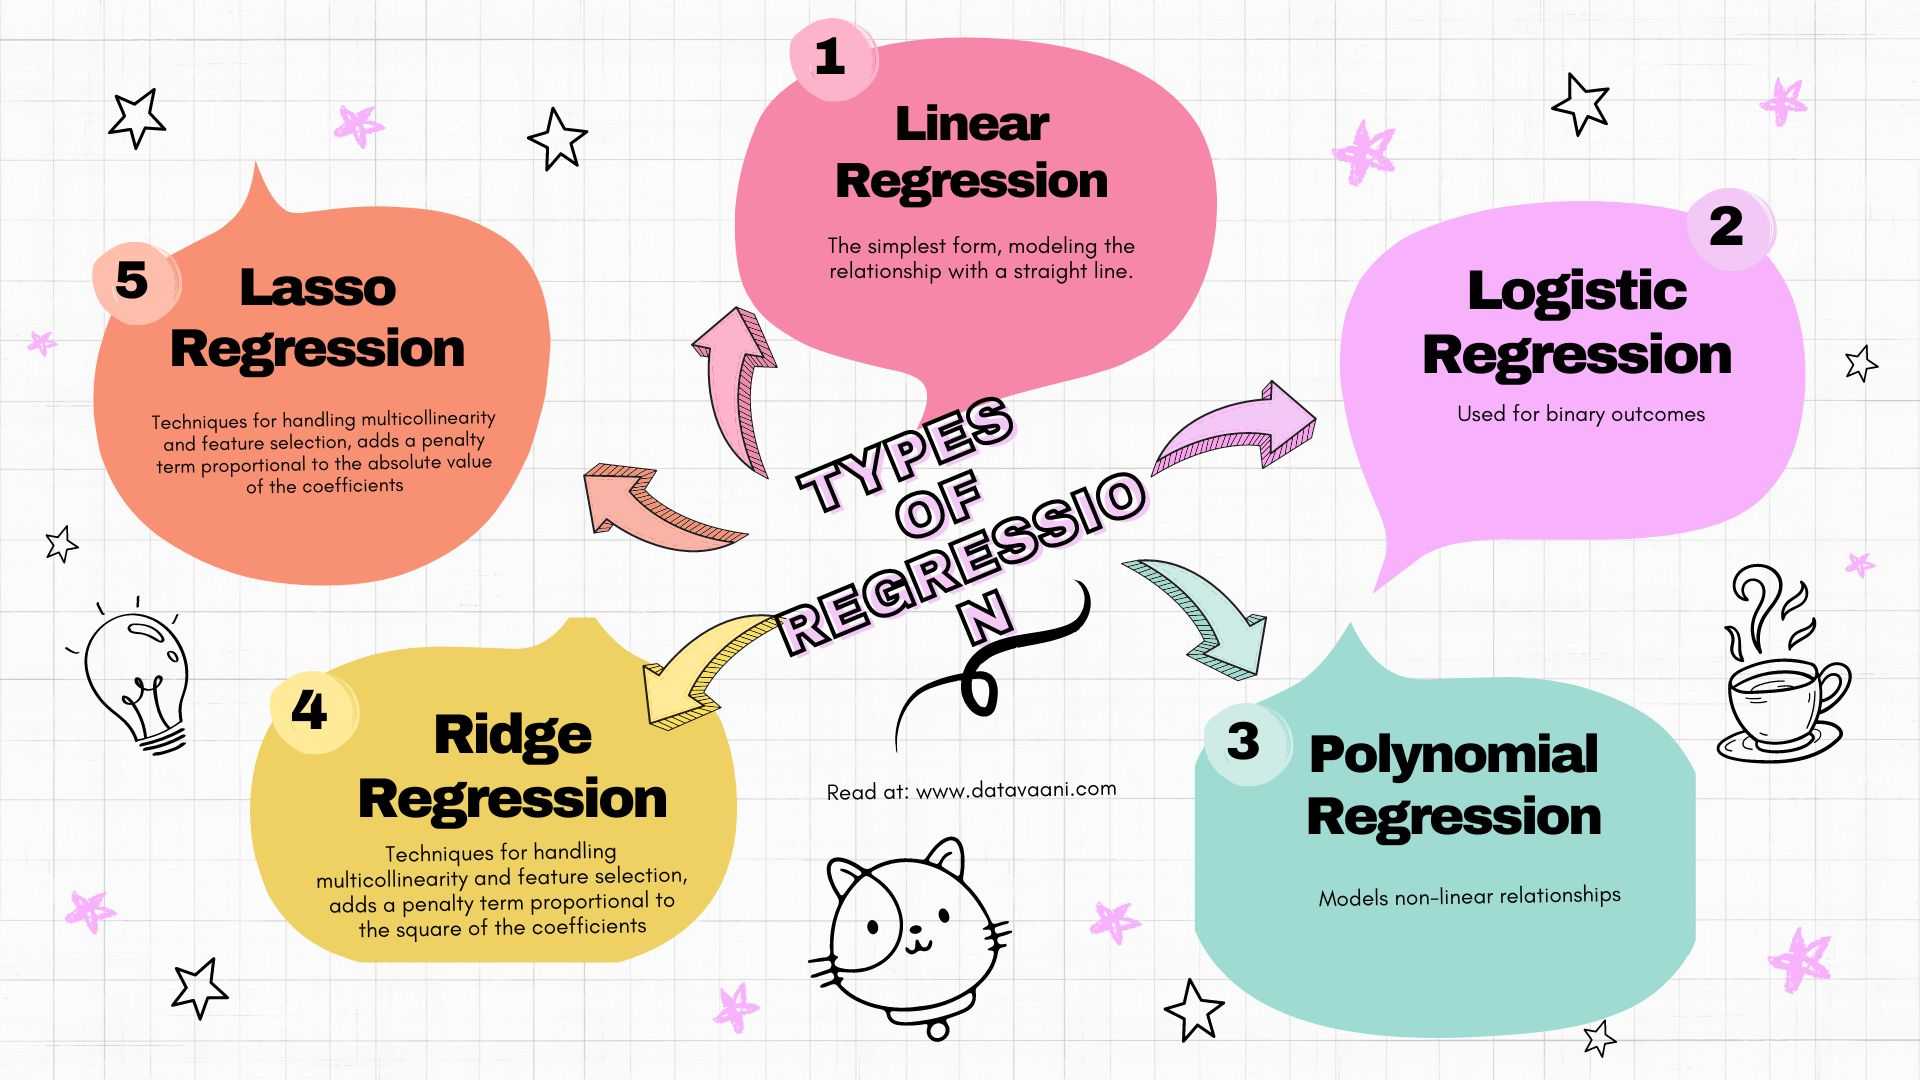
Linear regression is the simplest form of regression analysis. It models the relationship between the dependent and independent variables with a straight line. This technique is suitable for cases where the relationship between variables is linear, meaning it can be represented adequately by a straight line.
Logistic Regression
Logistic regression is used for binary outcomes, where the dependent variable is categorical with two possible outcomes. It predicts the probability of a certain class or event existing, such as whether an email is spam or not.
Polynomial Regression
Polynomial regression is used when the relationship between the independent and dependent variables is non-linear. It fits a polynomial equation to the data, allowing for more complex relationships than linear regression.
Ridge and Lasso Regression
Ridge and Lasso regression are techniques designed to handle multicollinearity and perform feature selection. Ridge regression adds a penalty for large coefficients to reduce overfitting, while Lasso regression can shrink some coefficients to zero, effectively selecting a simpler model.
Applications of Regression Analysis
Business Forecasting
In business, regression analysis is pivotal for predicting sales, stock prices, and market trends. By analyzing past data, businesses can forecast future performance and make strategic decisions to enhance growth.
Medical Research
Medical researchers use regression analysis to understand the impact of treatments and predict health outcomes. For instance, it helps in determining the effectiveness of a new drug or the risk factors associated with diseases.
Finance
In finance, regression analysis is employed for risk assessment, portfolio management, and predicting economic indicators. It helps financial analysts to understand market behaviors and make investment decisions.
Engineering
Engineers utilize regression analysis for quality control and reliability testing. It aids in predicting product lifespan and performance under different conditions, ensuring high standards and safety.
Types of Regression Techniques
Linear Regression
- Example: Predicting house prices based on size.
- Use Case: When the relationship between variables is linear.
Multiple Regression
- Example: Predicting sales based on advertising spend across multiple channels.
- Use Case: When more than one independent variable influences the outcome.
Logistic Regression
- Example: Determining the probability of a customer making a purchase.
- Use Case: When the dependent variable is binary.
Polynomial Regression
- Example: Modeling the growth rate of a population.
- Use Case: When the relationship between variables is non-linear.
Ridge and Lasso Regression
- Example: Handling multicollinearity in data.
- Use Case: When dealing with many correlated predictors.
Step-by-Step Guide on Performing Regression Analysis
1. Data Collection, Cleaning, and Preparation
- Collect Data: Gather relevant datasets from reliable sources.
- Clean Data: Handle missing values, outliers, and ensure data quality.
- Prepare Data: Normalize, transform, and split the data into training and testing sets.
2. Model Selection
Choose the appropriate regression model based on the data characteristics and analysis goals. For example, if the relationship between variables appears linear, linear regression is suitable. If there are multiple independent variables, consider multiple regression.
3. Fitting the Model
For instance, in linear regression:
from sklearn.linear_model import LinearRegression
model = LinearRegression()
model.fit(X_train, y_train)
Interpret the coefficients to understand the relationship between variables. The coefficients indicate how much the dependent variable is expected to increase when the independent variable increases by one unit, holding other variables constant.
4. Interpreting the Results
Assess the model’s performance using metrics like R-squared, Mean Squared Error (MSE), and visualizations. R-squared indicates how well the model explains the variability of the dependent variable. A higher R-squared value means a better fit.
Tools and Libraries for Regression Analysis
R
R is widely used for statistical analysis, offering robust tools for regression modeling.
model <- lm(y ~ x, data = dataset)
summary(model)
This code snippet fits a linear model and summarizes the results, providing key insights into the relationships between variables.
Python
Python, with libraries like scikit-learn and statsmodels, is also popular for regression analysis.
import statsmodels.api as sm
model = sm.OLS(y, X).fit()
print(model.summary())
This code fits an Ordinary Least Squares (OLS) model and summarizes the results, making it easier to interpret the model’s effectiveness.
Challenges and Considerations
Common Challenges
- Multicollinearity: Occurs when independent variables are highly correlated, making it difficult to isolate the effect of each variable.
- Overfitting: Happens when the model performs well on training data but poorly on test data.
- Underfitting: Occurs when the model is too simple to capture the underlying pattern in the data.
Best Practices
- Feature Engineering: Create meaningful features from raw data to enhance model performance.
- Regularization: Use techniques like Ridge and Lasso to handle multicollinearity and prevent overfitting.
- Cross-Validation: Validate the model with different subsets of the data to ensure its robustness and generalizability.
Conclusion
Regression analysis is a powerful tool in data science, essential for predictive modeling and data-driven decision-making. By understanding and applying the appropriate regression techniques, data scientists can unlock valuable insights and drive impactful outcomes. Whether predicting market trends or understanding medical data, regression analysis provides the foundation for informed, strategic decisions.
